Some time ago, I listened to a talk of Adam Tornhill about behavioral code analysis. As a software developer, I was curious as the term was unknown to me until then.
So what is it about? Short answer simplified: It is not about code behavior. It is about what behavior leads to the code!
So why could one be interested in that? What are the benefits of this approach for a software developer? These are questions to which I try to bring answers in this post (or at least give you an impression) by looking at a tool called CodeScene.
Motivation
Most questions for growing and “mature” software projects are about code quality and maintenance:
- How can we maintain large complex systems?
- Which parts need refactoring? And how do I identify the most crucial/urgent ones?
- Which parts are likely to contain bugs?
- What are the technical debts and how communicate them to stakeholders?
- What metrics can we use to support us?
Hotspot Analysis
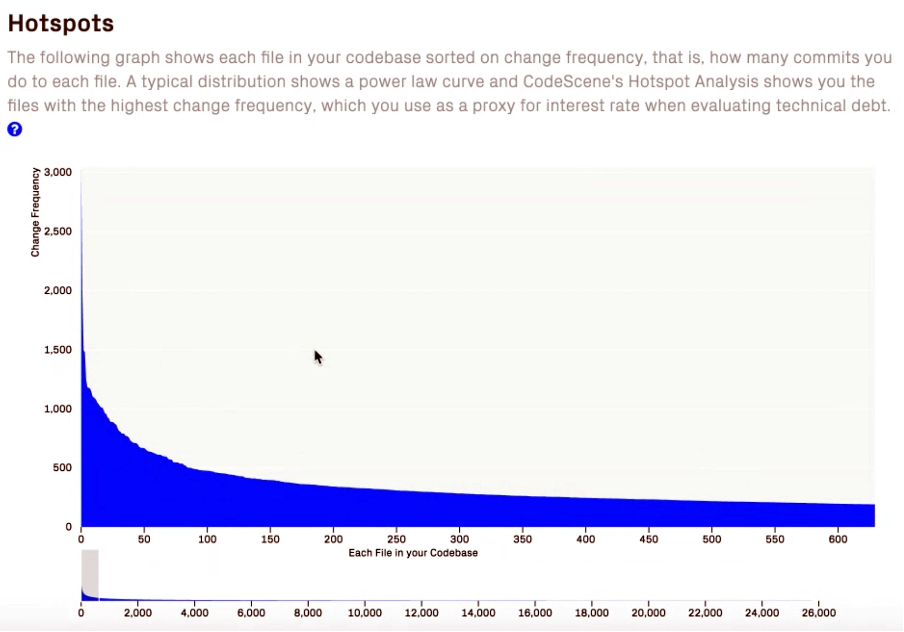
What are parts of source code where developers work on the most? Right, these are the files that are committed the most often. You can find that out quite easily by having a look at your version control’s commit history. If you do some file-based statistics you’d be able to locate parts of your system that are changed most frequently (left side of the graphic below) and those that are rather stable (right side):
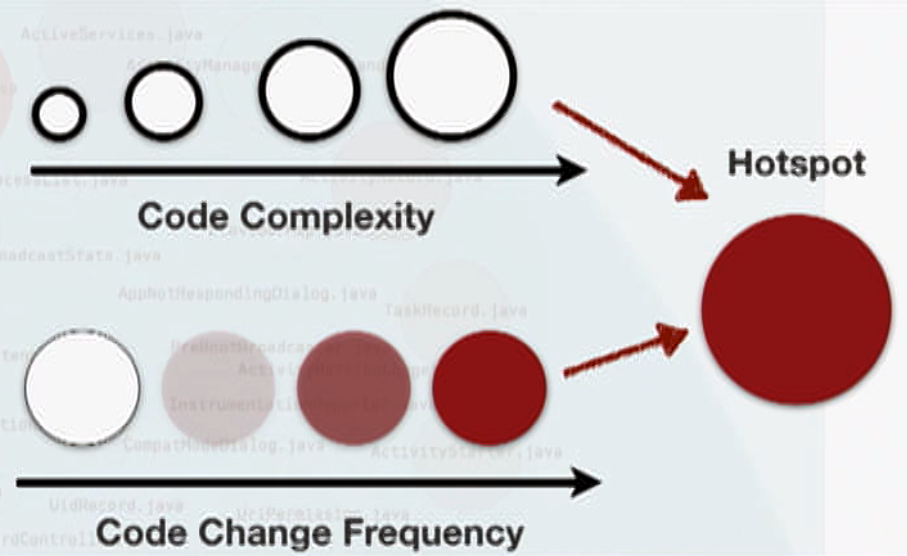
If you combine these findings with code complexity (i.e how hard it is for a human to understand the code) you are able to identify the “relevant” parts of your project. These are the ones you should consider for improvement, so-called hotspots.
CodeScene allows you to do that on different abstraction levels like modules, classes, even down to functions (using “X-Ray”), which might come in handy as you probably won’t refactor a whole class at once (at least not if it is a large and complex one which undergoes many changes). You could also use git to see a commit history on function-level like this:
git log -L :<functionName>:<file>
The following graphic represents some project as a reactive hierarchical visualization of its folder structure allowing you to zoom into the hotspots. In this case, overlaid by some code-quality metrics.
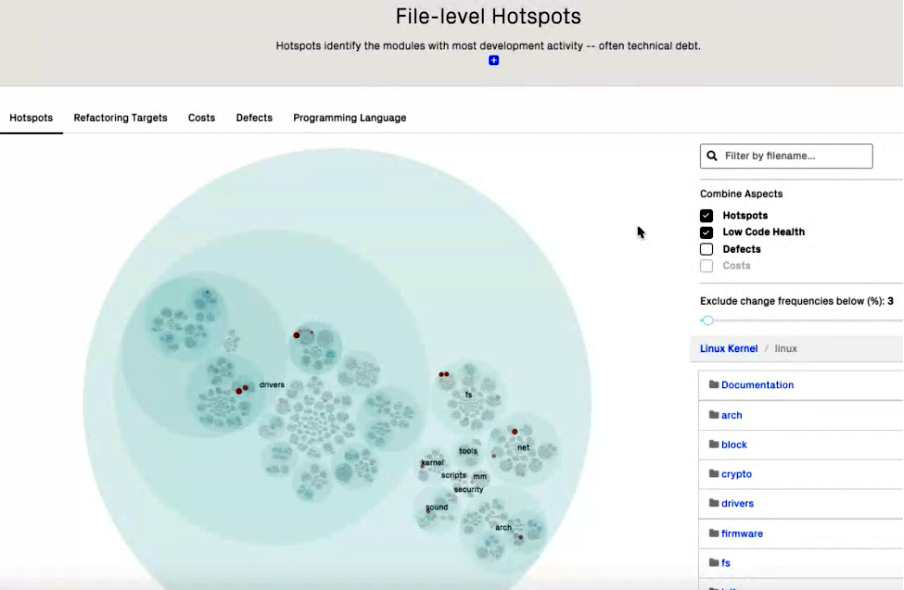
The size of each circle represents the complexity of the comprised source code, which depends on the zoom level: The highest level is the project folder and the lowest (most detailed) level represents one file.
Thesis: Parts of your code that are not changed frequently are either stable or not very important from a project’s / customer’s point of view.
Principle Idea: Do not refactor code…
- that has been stable for a longer time!
- that contains features that are of low interest to the customer (Yes, that might hurt 😉 !).
Conclusion: Technical debts in hotspots are more expensive (as developers get confronted with them more often), thus code health should be good.
Metrics
- Complexity
What metrics could support us speaking of code complexity?
Take cyclomatic complexity as an example. It gives a rough idea of how many unit tests are needed but does not really tell us about how complex the code really is.
Behavioral code analysis is programming language independent, as it works based on git commits and their contained info. Complexity is approximated by deriving it from a line indentation-based approach. Yes, that simple: It counts the number of spaces! As this first might sound a bit naive, I am convinced that it works out quite well. I admit that every programming language has its own semantics and syntax-dependent layout but, still, we normally agree on a coding style in the team and have a fixed indentation for the same thing (so they are not random). If you try to think of when the indentation number rises, you get aware that it happens mainly in two cases:
a) You increase the lines of code (growing project);
b) You increase the amount of nested structures (which means increasing complexity).
The counting itself might be just a number. The trick is to put it in relation to time and thus focus on trends rather than on absolute values. By doing so and also looking at the lines of code lets you spot code that gets more (or less) complex. The graphic below shows the complexity trend of a “hotspot file”.
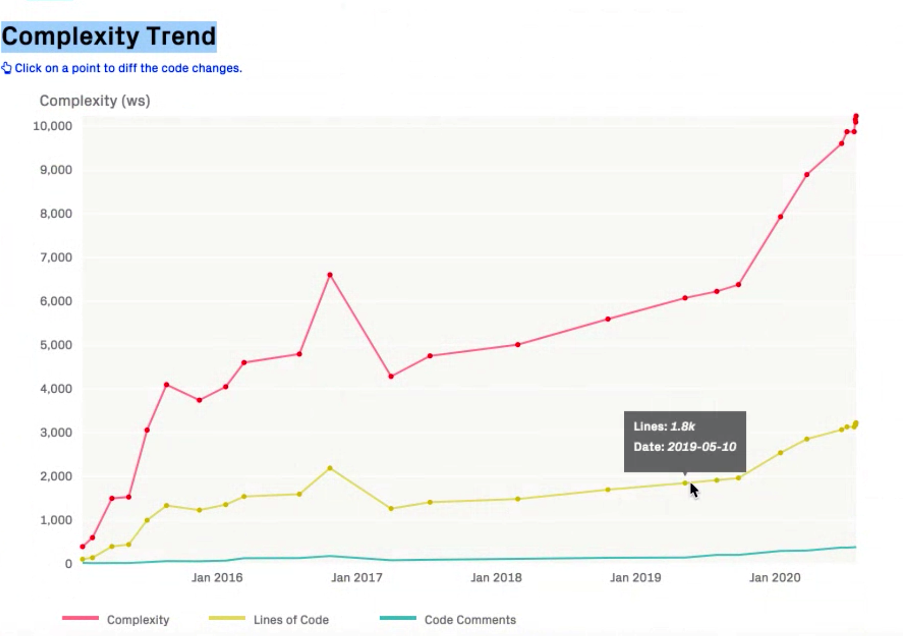
As you can see, in the above example the line number increases but also does the complexity in an over-proportional way. This indicates a problem.
- Healthiness
CodeScene also provides views showing healthiness trends. See below an example of the kubernetes project:
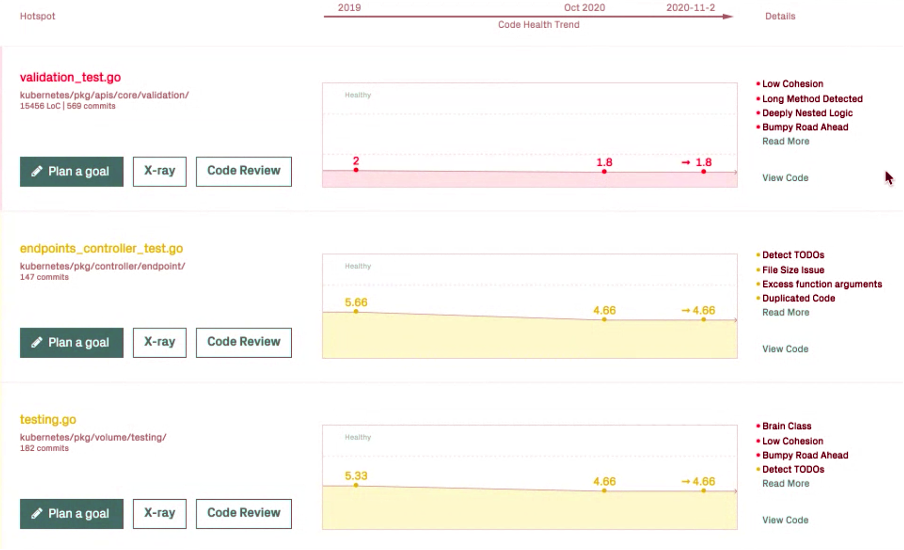
Clicking on “Code Review” also offers you a list of code health findings. Here’s an example of some random open source project:
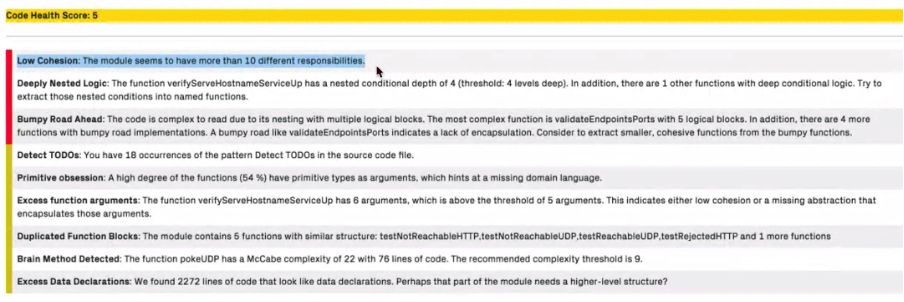
Of course, there are other tools that do the same thing and maybe not all findings are important in your team members’ opinion. However, combined with the identified hotspots you might have a closer look at the findings – which otherwise could simply have been overlooked.
- Change-Coupling
Another interesting aspect of CodeScene is to look at the change-coupling: What other files are likely to be changed if I change some specific file?
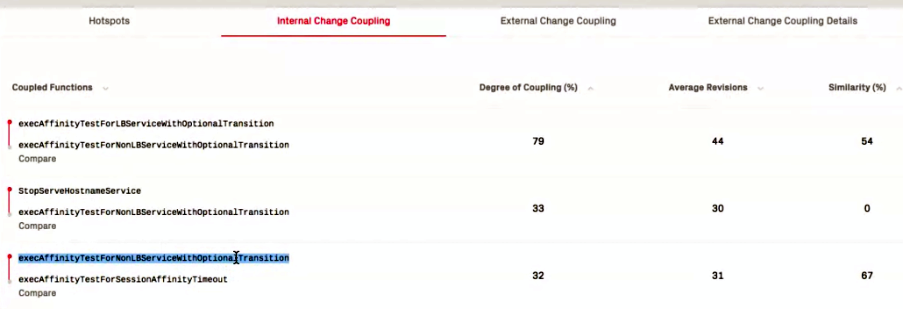
This helps you finding code duplication, for example. And it might also let you identify those parts that are not a 1:1 copy but differ in some logic. So, eventually, you could spot “quasi-duplication” that your IDE might fail to find. On the other hand, you might have some intentionally duplicated code. If never changed, this would not be a problem at all…
Exemplary refactoring approach:
- See what classes are highly probable to be changed if I change some class due to coupling (change-coupling)
- Spot code duplications / parts with high similarity
- Raise those issues to a higher abstraction level
As change-coupling analysis is programming language independent, it can even be done across systems (e.g. backend/frontend) giving you the opportunity to spot architectural design problems. Below you see changes across commits that identify coupled “systems”. So maybe it could make sense to have those encapsulated in a way (Microservice, ….). You can identify such repository-spanning couplings by searching for the same task-ID in the commit message. This will of course only work out if you don’t split your user stories system-wise.
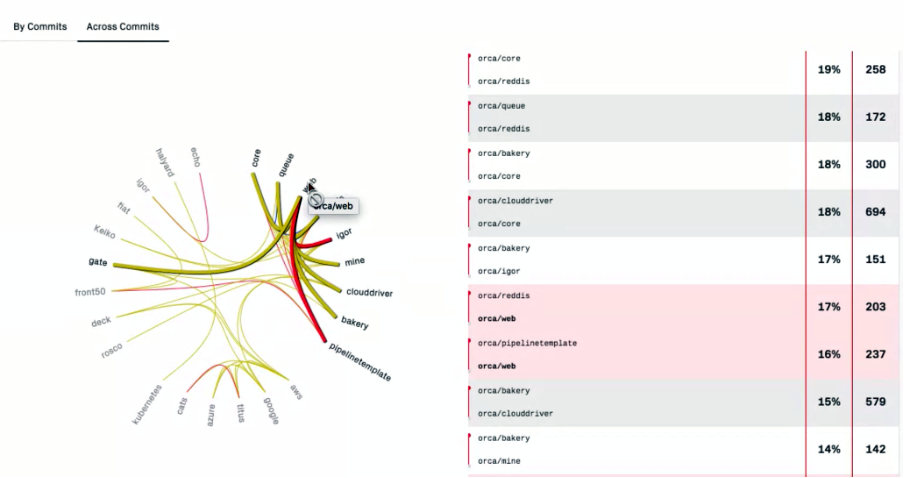
The idea should always be to drive architectural decisions domain-specifically and not technically. The reason is obvious: The customer will sooner or later introduce new features or rise feature-driven change-requests. From my experience, all – or at least almost all – functional changes will be based on domain-specific aspects rather than on technical ones. In order to keep changes “local” and coupling of your components low, it makes sense to put those parts together.
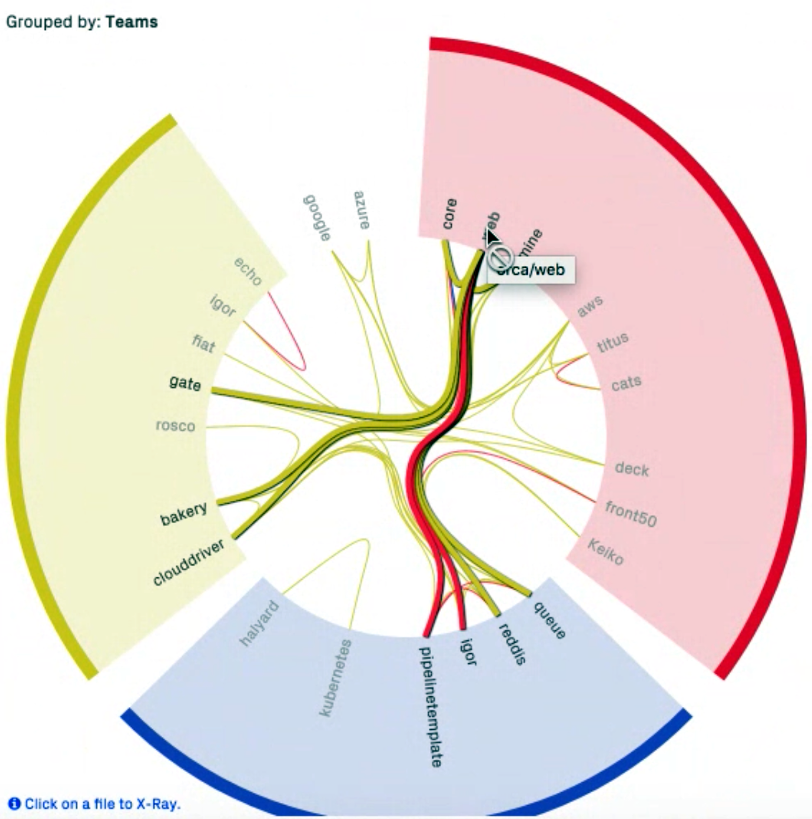
In larger systems you can even find services that cross organizational boundaries if you group the data by teams:
Onboarding new Team Members
One big challenge I did not mention is to integrate new team members – socially and technically. If your team grows – and mostly it does when projects start to burn and all team members can’t spare a lot of time anyway – you want the new members to be productive as soon as possible. So one goal is probably to get them into the code as quickly and efficiently as possible. While at Viaboxx we determine a mentor for that (mostly an experienced senior developer), there are at least two issues involved:
- The senior is partially absorbed as he has to coordinate and support the new employees. He cannot develop and is not available for driving the project forward as before.
- You still have to identify what code passages to look at first.
It even might get worse if a team inherited the code and does not know the complex parts and where to start looking at. So you need code mastering metrics, kind of…
By focusing on hotspots you make sure that you don’t look at irrelevant parts that currently nobody cares for. If you combine those hotspots with low-health parts, new employees could start refactoring small parts, for example. This allows them to be productive from the start and also get into the “current topics”. Reviewing by senior developers then reduces the risk of breaking stuff – as well as having meaningful tests, of course.
Technical Debts
I think we all agree that it makes sense to reduce technical debts for various reasons. The most important are: being able to quickly react to future requirements and to provide a business value to the customer. One way is to keep complexity low or reduce it. If we don’t work on that, it might become more and more unpredictable how long it will take for changes to be implemented, apart from other well-known side-effects.
So how to communicate technical debts – and the necessity to reduce them – to stakeholders? One approach is by quantifying them to numbers (5 days for a module, 1 year for the whole system, etc). However, technical debts cannot be calculated from source code as they do not only contain the costs for simply fixing the code but also for onboarding, debugging, bug fixing, testing, deploying, and more.
Moreover, complexity itself is not necessarily a problem (for example if it is in parts of low customer interest, so you don’t have to deal with it). Also, technical debts themselves are not actionable without knowing the business impact mapped to them. A common approach to reducing the measured numbers is not meaningful, as that will most probably lead to working on the “easy” issues first and not dealing with those that increase the business value. Adam Tornhill states that this “interest-rate” is directly reflected by the hotspots.
Sources
Thanks to Adam Tornhill for the input of this blog post.
- Blog about code quality to be seen in context: https://adamtornhill.com/articles/code-quality-in-context/why-i-write-dirty-code.html
- Tool for analyzing git commits: adamtornhill/code-maat
Recommended Books
- Your Code as a Crime Scene: https://pragprog.com/titles/atcrime/your-code-as-a-crime-scene/
- Software Design X-Rays: https://pragprog.com/titles/atevol/software-design-x-rays/

